YMI 1.0
The original TradingView signal
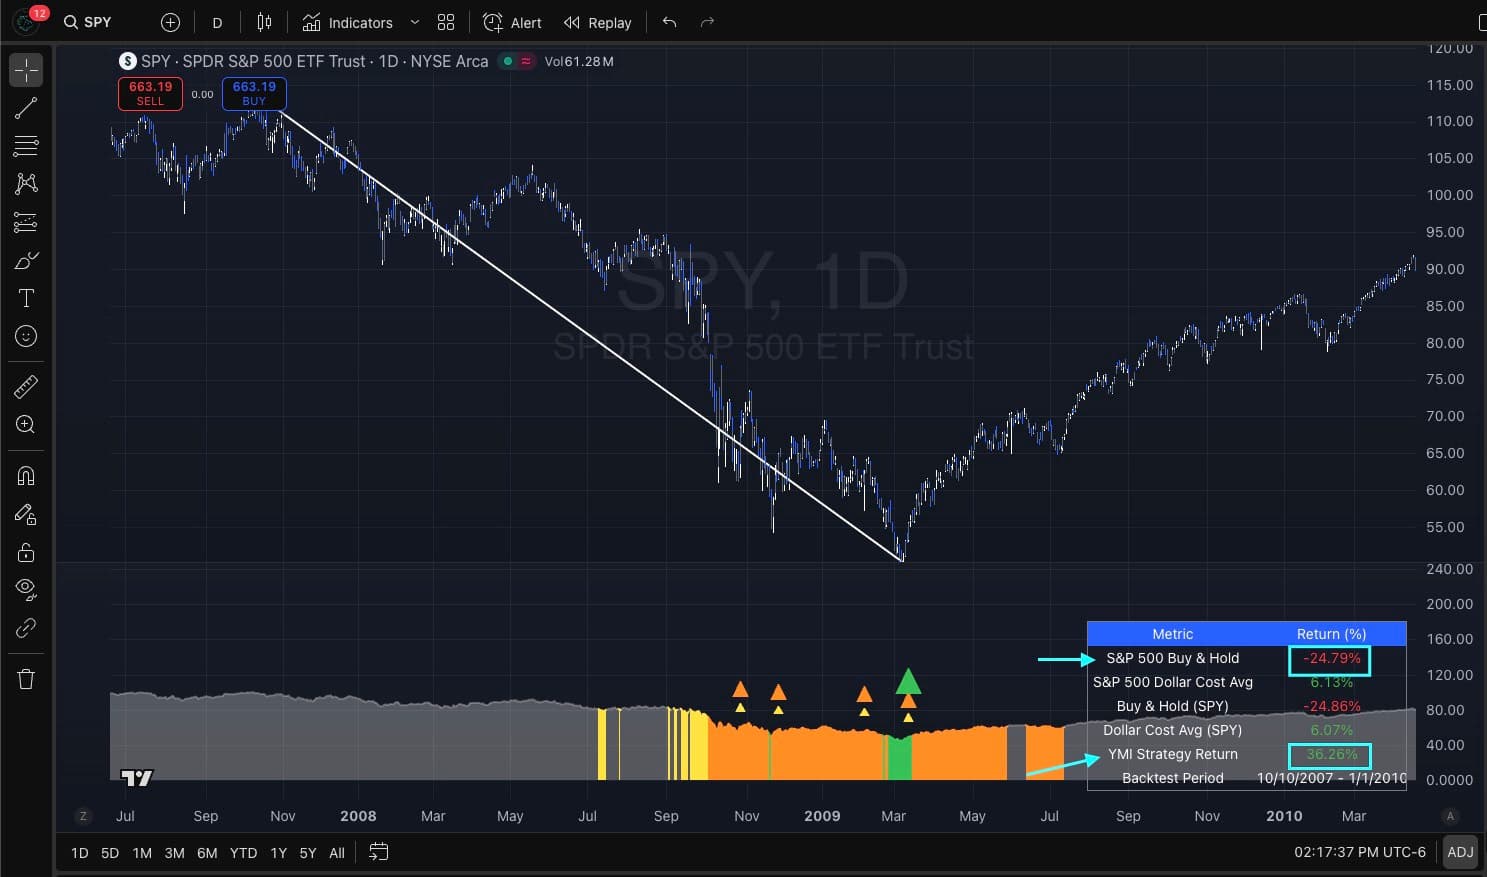
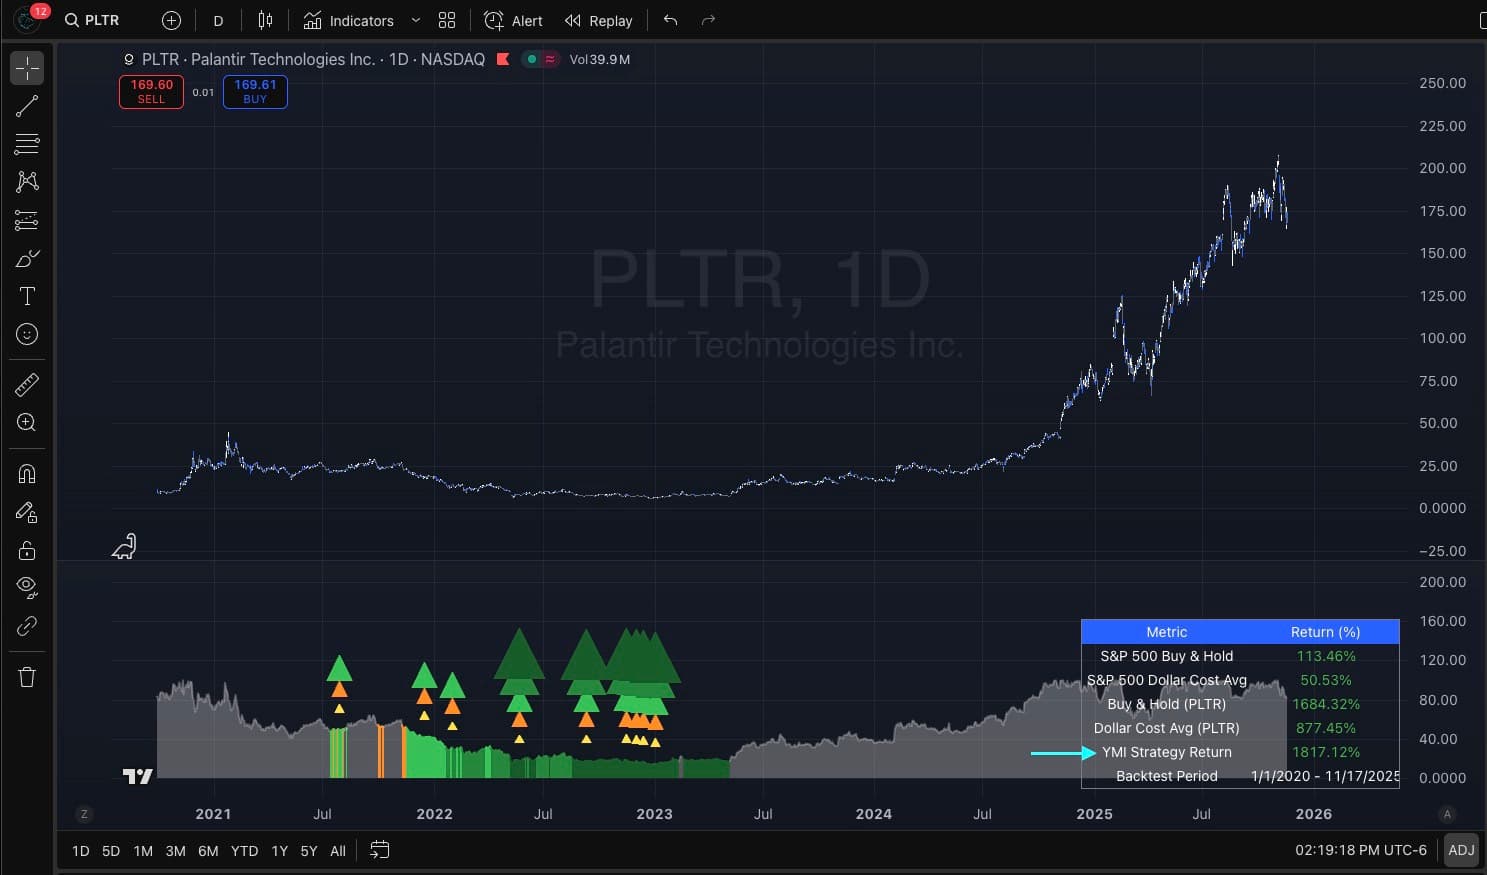
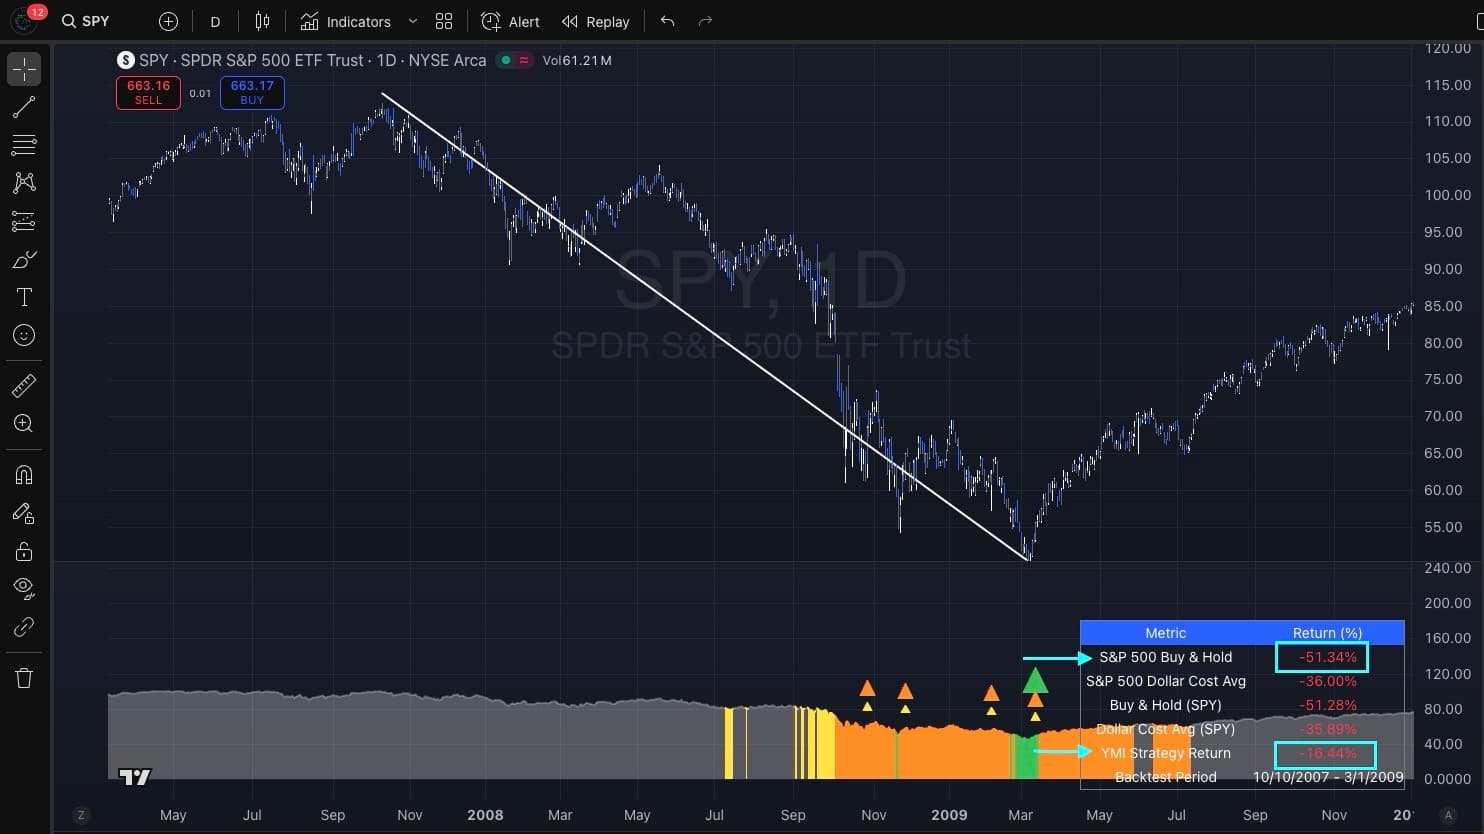
Built for daily stock and ETF charts, YMI 1.0 combines pullback depth, long-term trend context, and a confirmed momentum turn. It waits for weakness to persist before marking a qualifying long setup, helping investors avoid treating every decline as an entry.
Benefit: a visible, repeatable TradingView signal that separates setups by pullback depth.